Introduction
Battery life, power consumption and fan noise are closely related. If the system consumes more power than necessary at low load, then the case temperatures increase, the fan noise increases and the battery life decreases.
An unnecessarily high power consumption can have various root causes:
- A background process permanently loads the CPU, possibly even only a single CPU core.
- Despite hybrid graphics, the dedicated graphics card does not switch off because something is keeping it awake.
- A component or a driver prevents the CPU from entering deeper sleep states despite being idle.
- A component (e.g. SSD) creates a high consumption for itself in idle.
Sometimes several of these factors can play a role at the same time.
The following sections will shed light on how to investigate these potential causes and eliminate them if necessary.
Examine CPU utilization
Please follow the steps below:
- Open Windows Task Manager (Ctrl+Shift+Esc).
- Open the “Details” tab and sort it in descending order of CPU usage.
- Now the processes with the highest CPU usage should always be at the top of the list.
- If a process generates permanently more than 1~2% CPU load, this already indicates a problem.
Why can already single digit percentages be problematic?
Your CPU consists of multiple cores, e.g. 8 cores and 16 threads. The operating system sees threads as “logical cores” – from the operating system’s point of view the CPU has 16 cores.
Now, if only one of these 16 cores is 100% utilized, then Windows will show an overall utilization of only 6 to 7%. Why? Because: 100% divided by 16 cores is 6.25%.
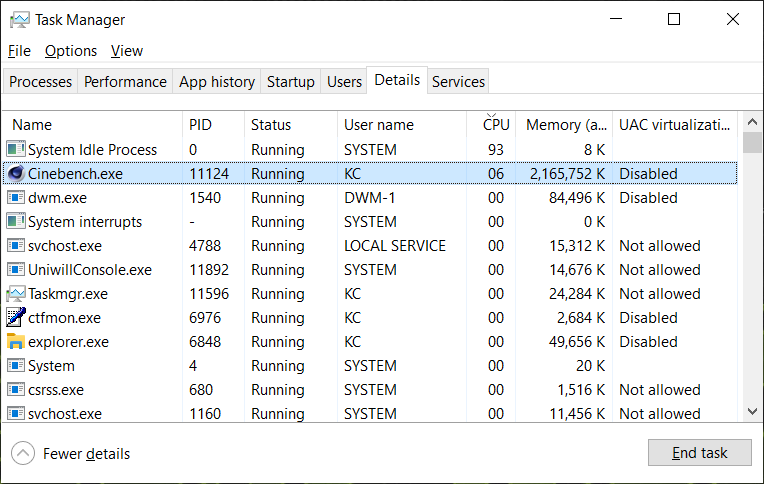
Screenshot: Task Manager with Cinebench R15 in “Single” mode.
Since the other 15 logical cores have virtually nothing to do in this example, the CPU puts all its energy into the one single core that is active, to make it clock as high as possible. The consumption of the individual cores is therefore not constant, but scales dynamically with the respective load. A load of “only” 6% already leads to the CPU consuming almost half of the specified TDP (Thermal Design Power).
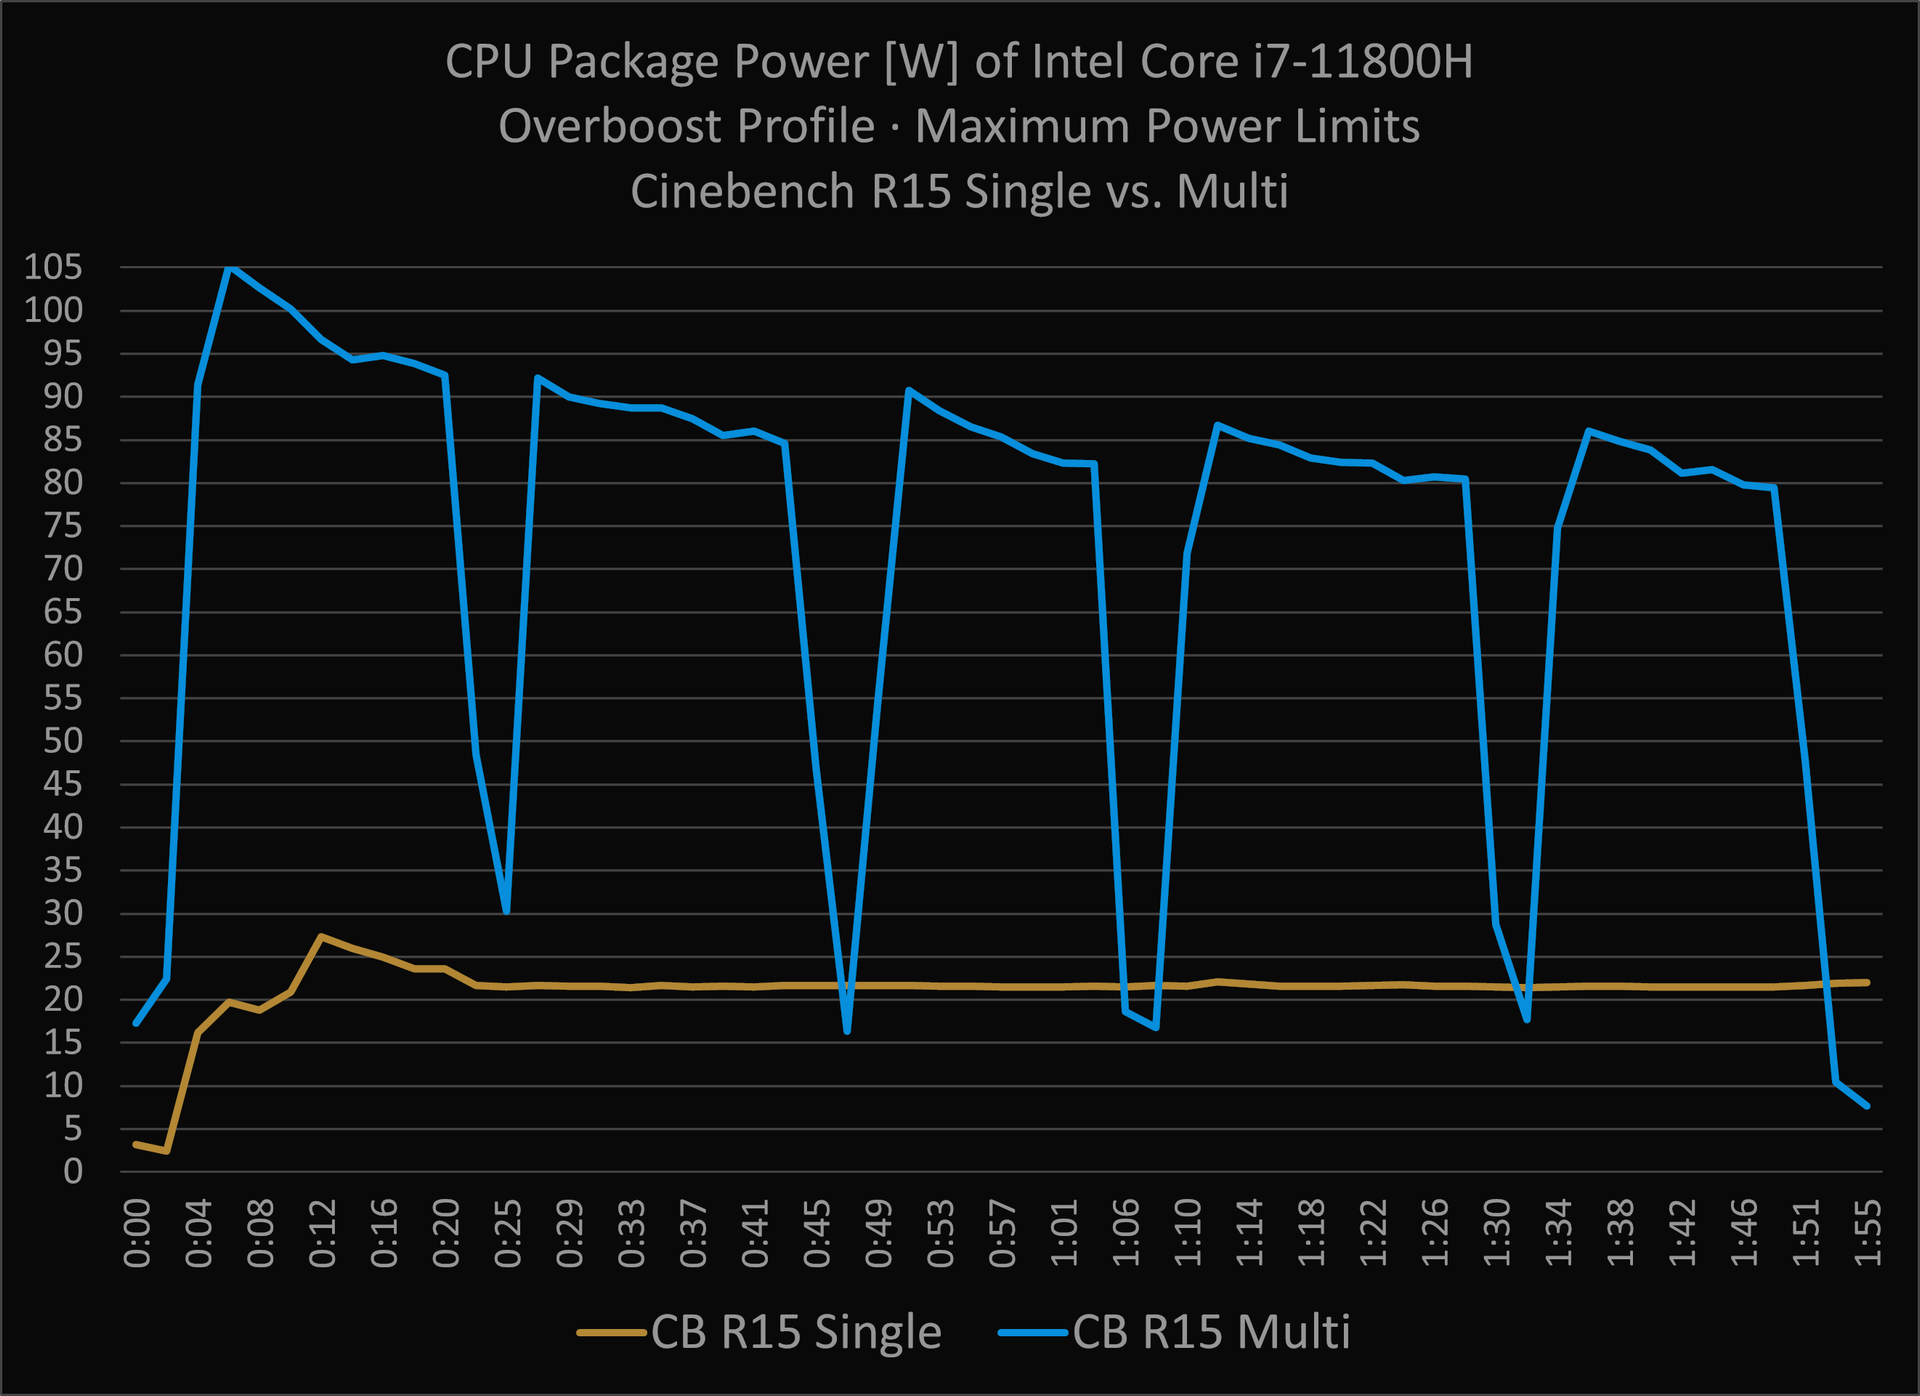
This diagram shows the energy consumption of an i7-11800H in XMG CORE 15 in Cinebench R15 Single compared with R15 Multi. The “Multi” benchmark is repeated 5 times in a row here because it is over so quickly. The vertical axis shows the CPU consumption in watts, the horizontal axis the time (total 1 minute, 55 seconds).
You can see from this graphic:
- The multi-benchmark briefly reaches 105 watts and then tends towards 80 watts due to control temperature.
- The single benchmark briefly reaches 27 watts and is then remains at 22 watts for the rest of its duration.
22 watts is pretty much exactly half of the TDP of 45 watts – so the CPU is already quite busy with a load of nominally “only 6%”. By the way, the CPU’s idle consumption should normally be 3 watt or less.
How do I see if the CPU load is concentrated on one core or if it is evenly distributed?
Please follow these steps:
- Click on the “Performance” tab in the Task Manager.
- Right-click on the big diagram and select “show logical cores” (see screenshot).
The performance diagram now shows all threads (all logical cores) individually. From this you can see very well if a single core is fully loaded. Sometimes it happens that certain system or background programs are badly programmed, have a bug or simply crashed. Something like that then manifests itself in a high load of a single core. If you have identified such a program in Task Manager, please terminate the program or uninstall it completely.
What if I don’t find anything in the Task Manager or the result is not clear?
Very rarely it happens that the Task Manager cannot see certain programs and background services. Or even if it does, the entries (sorted by CPU) constantly jumping back and forth are a bit confusing. Let’s check out a more powerful tool (also free of charge) directly from Microsoft:
Here is how it works:
- Download, unpack ZIP, start procexp.exe with admin rights
- Sort the processes in the list by CPU
- Better: Right click on the table header of the process list → Select Columns… → Process Performance → Check “CPU Time”.
- This will bring up a new column on the right called “CPU Time” by which you can now sort the list.
- “CPU Time” shows the cumulative CPU usage of all processes since the last restart (i.e. not just since Process Explorer was started).
A few programs will always be at the top of this list:
- “System Idle Process” and “Interrupts” – this is effectively the idle time.
- dwm.exe – this is the Windows component that takes care of rendering all windows. If you move windows back and forth, you will see the load of dwm.exe increase – this is normal.
- svchost.exe – this is the collection process under which countless background services are operating. As long as this is not at the top of the list, you can pretty much ignore it, because most of the services (especially the services which are not Windows on-board) are listed separately in Process Explorer.
- WmiPrvSE.exe – this is the “WMI Provider Host”, a core component of Windows. Can be ignored as long as it is not above dwm.exe.
- System – also a collection process. Contains among other things the “Interrupts”. Can probably be ignored.
Again, a process that constantly causes more than 1% CPU load at idle is fundamentally suspicious.
If you are not sure how to interpret the values, please take some screenshots (snipping tool) and contact our community or support.
Examine power consumption: CPU, graphics card and battery consumption
If Task Manager and Process Explorer don’t immediately reveal a cause, we’ll go one step deeper. For this we use the system monitoring program HWiNFO64. With it, you can display sensor values like energy consumption and temperatures in clear visual diagrams.
There are other programs that do the same – but HWiNFO64 is in our opinion especially well suited, because its programming is extremely light on resources and thus does not interfere with the sensitive idle power consumption. More information about this can be found in the FAQ category “Tips” under the question “Which tuning and system software is recommended by XMG?”.
To observe the energy consumption with HWiNFO64, please proceed as follows:
- Set your laptop to a moderate performance profile, e.g. “Balanced” or “Entertainment” mode (depending on the model).
- Remove the power adapter to switch the laptop to battery mode.
- Start HWiNFO64, select “Sensors only” and click on “Run”.
- A long list of sensor readings will open.
- We will now display a chart for a few selected readings. To do this, we scroll down and double-click on the desired values:
- CPU Package Power
- GPU Power
- Charge Rate
Each chart has an upper and lower limit predefined by HWiNFO64. CPU Package Power, for example, has an upper limit of 300 watts by default – this is obviously much too high for our purpose. For an idle investigation, we would recommend setting the CPU’s upper limit to 45 watts. Alternatively, you can simply click on “Auto Fit” in each chart – then the limits automatically adjust to the smallest and largest measured value in each case.
If you cannot find “GPU Power”, then your NVIDIA graphics card is probably still sleeping. Check this by briefly opening the NVIDIA Control Panel (right-click on the desktop). This will wake up the NVIDIA GPU for a short moment and register it with HWiNFO64. Afterwards the GPU should go back to sleep and show a GPU power of “0” (zero) in HWiNFO64. You can now close the NVIDIA control panel.
If you cannot find “Charge Rate” (located at the bottom of the list), then you are not in battery mode. If you are in battery mode, “Charge Rate” will show a negative (minus) value. The value shows how much energy (in watts) is drawn from your battery.
Clarification: a “Charge Rate” value of -30 is considered higher than -7 in the further text, because it indicates a higher consumption (30 watts is more than 7 watts).
What conclusions can I draw from these values?
The values interact with each other. If the GPU is active, then the CPU consumption also increases because the CPU has to maintain a PCI Express connection to the GPU. If the CPU and GPU consume a lot of energy, the battery consumption naturally increases as well.
To rule out the individual causes, we proceed as follows:
- “GPU Power” is permanently above zero? → GPU is not sleeping.
- “CPU Package Power” is permanently above 3 watts, although “GPU Power” is at zero? → Something is keeping the CPU busy.
- “Charge Rate” is consistently over 10 watts even though the GPU is at zero and the CPU is less than 3 watts? → Some other component is causing the power consumption.
The following sections address each of these three core causes.
Why won’t my GPU go to sleep?
If your GPU power is at 0 watts (zero watts) or not even listed in the first place, then it is apparently sleeping. That’s good! In this case you could skip this section.
If your XMG laptop is equipped with a desktop CPU, you can also skip this section. Laptops with a desktop CPU do not use NVIDIA Optimus – the dGPU is thus always active.
Explanation of terms:
- iGPU = Integrated Graphics, i.e. the “small” graphics unit in your Intel or AMD CPU.
- dGPU = Dedicated graphics, i.e. the “big” graphics card from NVIDIA
If the dGPU doesn’t go to sleep when idle, this can have various causes:
- NVIDIA Optimus is disabled.
- On some XMG laptops, you can disable NVIDIA Optimus in Control Center or in BIOS setup. This connects the laptop’s display directly to the NVIDIA GPU. In this state, the GPU can never go to sleep.
- Solution: → Re-enable NVIDIA Optimus.
- An external display is tethered to the NVIDIA GPU.
- On most XMG laptops, the HDMI and DisplayPort outputs are connected to the NVIDIA GPU. Once an external monitor is tethered there, the GPU cannot go to sleep. So this is normal.
- Solution: → disconnect external monitors.
- A program is executed on the NVIDIA GPU.
- With NVIDIA Optimus enabled, Windows can run any program on either the iGPU or the dGPU. Similarly, programs running on the iGPU can call on (“wake up”) the dGPU for additional calculations. Windows controls whether a program is executed on the iGPU or the dGPU by means of a certain automatic feature. This is explained in more detail in the next section.
How does Windows decide whether a program should be executed on the iGPU or the dGPU?
In the past, this selection was the responsibility of the NVIDIA Control Panel. There, you were able to specify which GPU should generally be preferred and you could set exceptions for custom programs.
Windows 10 has taken over this control since around 2019. The corresponding menu can be found by searching for “Graphics” in the Start menu.
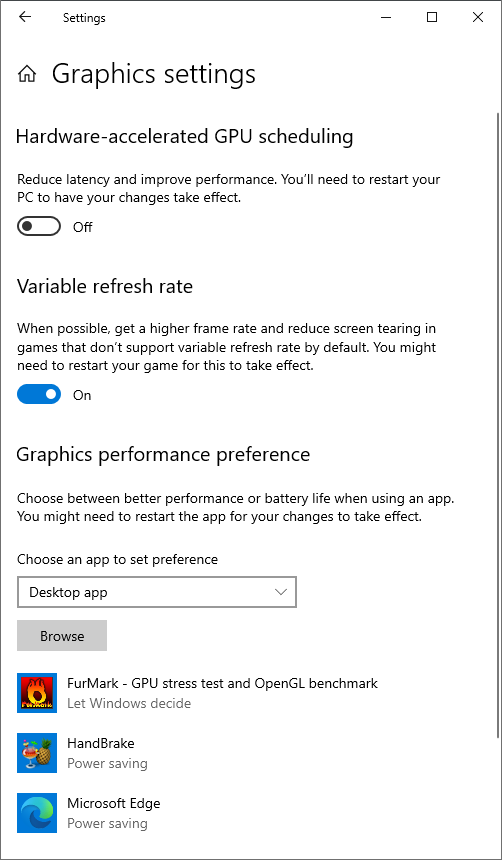
The GUI for selecting the integrated and dedicated graphics card still exists in the NVIDIA Control Panel (see screenshot) – but it no longer has any effect there. Since then, the system works as such:
- Microsoft has an internal (non-public) list of program names. In this list, Microsoft specifies on which GPU a program should be executed. It can be assumed that Microsoft basically runs all 3D programs on the dedicated GPU. This also includes quite simple 3D programs like Microsoft’s own “Paint 3D”.
- You can set an unlimited number of user-defined exceptions in Windows Graphics settings. Thus, you can manually specify whether certain programs should be executed on the iGPU or the dGPU.
- If a program to be executed does not appear on Microsoft’s internal list nor in a user-defined exception, then the NVIDIA control panel takes control and starts the program based on an NVIDIA-internal list or based on an exception configured in the NVIDIA Control Panel.
The system thus determines on which GPU a program should be executed according to a predefined order. The priorities are set as follows:
- Microsoft List → Custom Exception in Windows Graphics settings → NVIDIA Control Panel
The NVIDIA Control Panel is at the very end of this chain and is thus virtually obsolete in terms of choosing between iGPU and dGPU.
How do I find out if a program is running on the dGPU?
There are two methods. First, you can add another column in Task Manager under “Details”, called “GPU engine”. Right-click on the table header, select “Select columns” and check “GPU engine”. The new column will appear on the far right. With drag & drop you can move it to the left. Now sort the processes in descending order by this column.
As soon as a process uses the hardware acceleration of a GPU, it will be displayed in Task Manager. The two GPUs are numbered.
- GPU 0 = iGPU (energy saving GPU)
- GPU 1 = dGPU (dedicated GPU)
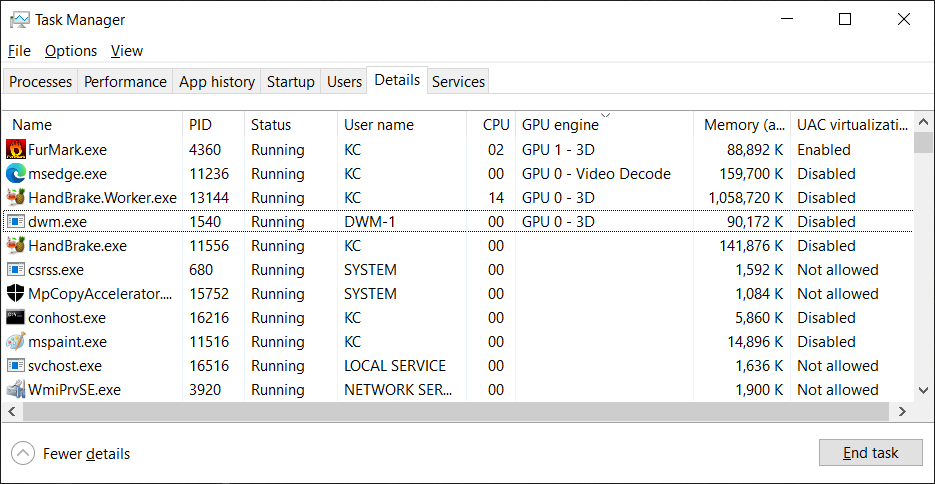
Example in screenshot: the graphics benchmark “Furmark” renders on “GPU 1”, while HandBrake encodes a video on “GPU 0”. Edge browser and dwm.exe are also running on the iGPU.
Second method:
- Open the NVIDIA Control Panel and select “Display GPU Activity Monitor Icon in Notification Area” in the menu at the top under “Desktop”.
- To find the new icon in the systray (the notification area of Windows at the bottom right, next to the clock), you will first have to expand the notification area by clicking on the small arrow. Then you can drag and drop the new icon and put it next to the clock to make it easier to find in the future.
- Clicking on the icon will open a small popup window. This shows a list of programs that are currently running on the dGPU (see screenshot).
Generally, when idle, this list should be empty. When the list is empty, the GPU should go to sleep (GPU Power at zero). If the GPU goes to sleep, then all is well.
If the GPU does not go to sleep even though the list is empty, then you may have a program running on the iGPU but keeping the dGPU awake as well.
How can I set a program to run on the iGPU?
As already described, these settings are located in the Windows Graphics settings. You can find them by searching for “Graphics” in the Start menu (see screenshot). There you click on “Browse” and look for the path of the .exe file that represents the program. Alternatively, you can select a shortcut on the desktop or in the Start menu here, as long as it points directly to the .exe file.
If you can’t find the .exe file of your program on the first try, please proceed as follows:
- Start the program that you want to put on the iGPU.
- Open the Windows Task Manager (Ctrl+Shift+Esc)
- Find the program in the list in the “Process” tab or in the “Details” tab
- After a right click on the list entry: select “Open file path”.
- The newly opened explorer window shows the folder where the .exe file of the program is located.
- Press Ctrl+L to switch to the Explorer address bar.
- Press Ctrl+C to copy the address path of the folder to the clipboard.
- Go back to the Windows Graphics settings and click Browse again.
- Press Ctrl+V to enter the address path from the clipboard into the search mask and confirm with “Enter”.
- Now select the .exe file and confirm again.
The new entry for your program is now in the list. This list is always sorted alphabetically. Select your program in the list, click on “Options” and select the desired graphics card for this program.
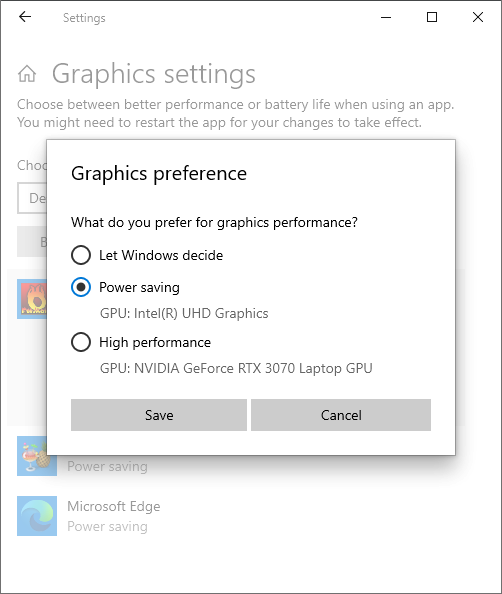 In the screenshot: Furmark is manually set to the iGPU.
Which programs are able to keep the dGPU awake, although they should actually run on the iGPU?
If a program insists on using the dGPU for graphics acceleration, it cannot be prevented in a general sense with on-board methods. Even if you define in the Windows graphics settings that the program should run on the iGPU, this does not prevent the program from using the dGPU anyway (if the program deems it necessary).
To test if a program is running its activities on the dGPU, you can again use Windows Task Manager:
- Select the “Performance” tab in the Task Manager and click on the history diagram of the NVIDIA GPU.
- Now open the program you want to test. Play around in the program a bit, e.g. by loading pages, starting actions or just zooming in and out.
- If you see a correlation between your actions in the program you are testing and the NVIDIA GPU activity in Task Manager, then it is very likely that the program is responsible for that activity.
Here is a list of programs that usually (unfortunately) keep the dGPU awake:
- Web browser
- All modern browsers (Edge, Chrome, Firefox) use hardware acceleration to speed up the building or rendering of websites.
- Usually it goes like this: if the browser detects that the dGPU is already running at startup, then the browser jumps on the bandwagon and uses it as well. Then the browser keeps the dGPU awake until the browser is terminated or restarted.
- This has the following effect: if you start a browser while an external monitor is connected to the dGPU, the browser will still use the dGPU even after you have disconnected the external monitor.
- Interesting fact: you can disable and re-enable the dGPU in Device Manager. This releases the browser from its dGPU “dependency” – without crashing. If the dGPU is then reactivated, it goes to sleep after a few seconds – the browser continues to run its hardware acceleration on the iGPU. So the old IT running gag is actually useful here: have you tried turning it off and on again?
- However, disabling the dGPU permanently in the Device Manager is not a solution. The reason for this is explained down below in the section “Disabling the dGPU manually is unfortunately not a solution!”.
- Solution #1: → Restart browser.
- Solution #2: → disable dGPU and reactivate it immediately (do not disable it permanently).
- Solution #3: → Disable hardware acceleration in the browser. Screenshots: Firefox, Chrome, Edge.
- Browser-based apps
- Many modern programs use a web browser engine. What has been said about web browsers applies to these apps, too.
- These include: Microsoft Teams, Slack, Discord, Spotify, Microsoft Visual Code and many more.
- Many of these programs use Electron as their engine, but some programs also use their own implementation of e.g. Chromium.
- Solution: → The above solutions #1 and #2 also work with these browser-based apps. An option for solution #3 (disable hardware acceleration) may also be available (example: Teams).
- System monitoring programs
- Some (not all) system monitoring programs keep the dGPU awake to read its values (e.g. temperature). This is the realization of Heisenberg’s uncertainty theorem: the observer changes the result by the act of observation.
- Which programs are acting like this can be found in the FAQ category “Tips” in the article about tuning and system software. Fortunately, HWiNFO64 is not
- Solution: → Terminate or uninstall such monitoring programs and switch to an alternative.
- Content Creation, Streaming and Video Encoding
- Programs that have something to do with video production like to use the dGPU to accelerate video encoding.
- An interesting example is HandBrake: by default the program starts on the dGPU and thus keeps the dGPU permanently awake, even if it does not render anything (e.g. in the “Open file” dialog).
- If you define in Windows Graphics settings that HandBrake should start on the iGPU, then it still wakes up the dGPU briefly at startup, but then puts the dGPU to sleep again when it has nothing to do. If you then select the NVEnc encoder in HandBrake and start a video encoding, the dGPU wakes up again and does its job properly.
- Conclusion: → Run video editing programs on the iGPU if possible. You can then still tell it to activate the dGPU as needed.
- Game Launcher (e.g. Epic Games Launcher)
- A “game launcher” is a program that is not yet a PC game itself, but only represents the “antechamber” of a PC game. In these “launchers” you can find e.g. advertising, option menus and access to DLC and other peripheral content of the game. Once installed, these launchers tend to run in the background (or hide in the systray) and keep the dGPU awake (see example).
- Solution: → Create an exception for these programs in the Windows Graphics settings and/or remove them from automatic startup.
The list is long, but certainly not yet complete. As an OEM, we unfortunately have no direct influence on these circumstances. Although we have forwarded our papers on this topic to NVIDIA and (later) also to Microsoft every now and then – not much seems to have improved so far. Apparently, it is the responsibility of Microsoft and their partners to create order in this “MSHybrid” standard and enforce reasonable defaults.
Incomplete driver installation can keep dGPU awake
We documented a case where a user had manually unselected the “Audio” and “USB-C” components during the custom installation of the NVIDIA driver. This resulted in the dGPU being permanently “On” even when idle, although it was demonstrably not being used by any program.
Solution: → Install the NVIDIA driver completely – do not uncheck any components.
Disabling the dGPU manually is unfortunately not a solution!
According to the information above, one could assume that it would be a good workaround (in battery mode) to simply disable the dGPU completely in the Device Manager. Unfortunately, this causes exactly the opposite of the desired result.
Why is that? When you disable the NVIDIA GPU in Device Manager, you don’t disable it in hardware. You are merely taking away the operating system’s ability to exert an influence on the dGPU’s activity. As a result, the dGPU is permanently “awake” without being directly visible. The “sleepless” dGPU also increases the CPU’s energy consumption.
You can see this very well by keeping an eye on the “Charge Rate” in HWiNFO64 in battery mode. In a correctly configured system, the charge rate should be less than -10 watts in idle (all programs closed). If you disable NVIDIA GPU in Device Manager, you will see the Charge Rate rise to over -30 watts and stay there.
Conclusion: → Disabling the dGPU manually is counter-productive. It needs to be tamed…
This was now the last word on the NVIDIA GPU. Let’s turn to the CPU next.
GPU is asleep, Task Manager is quiet, but CPU power consumption is still too high – what now?
If the GPU is demonstrably asleep (i.e.: not disabled Device Manager yet still zero watts GPU power in HWiNFO64) and you don’t find any abnormalities in Task Manager or Process Explorer, but your “CPU Package Power” is still constantly well above 3 watts at idle, it gets a bit complicated. The next couple of steps would be in the realm of “Trial & Error”.
But before that, we can break down the CPU consumption a bit more precisely.
Analyze CPU sleep states
Sleep states are cycles during which the CPU sleeps with various levels of intensity – the more time the CPU spends in such states and the deeper those states are, the less energy it consumes. At Intel and AMD, these sleep states are called “C-States” – and we always refer to the complete “package” of the CPU, i.e. not only the processor cores but also the integrated chipset and the iGPU.
Reminder: this analysis is only helpful if the NVIDIA GPU was already excluded as a root cause.
Sleep states can be analyzed very easily with HWiNFO64.
- Search in the sensors of HWiNFO64 for the value “Package C2 Residency”.
- Among them you will find a number of other so called C-States: C3, C6, C7 etc. – the higher the C-number, the deeper the CPU sleeps.
- HWiNFO64 shows in the column “Current” in % how much time the CPU has spent in which C-States during the last two seconds.
- The column “Average” gives an average value, measured from the time when HWiNFO64 was started. To restart the average measurement timeframe, you can click on the square button with the analog clock in the lower right corner.
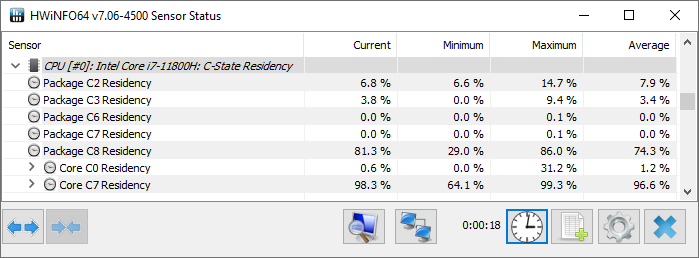
In idle you ideally want to spend as much time as possible in C8 or lower. Values of over 40% in C8 should be possible if all background programs are really closed.

Screenshot: an Intel Core i7-11800H with an average of 74.3% package C8 residency.
If your “CPU Package” is not in C8 at any time (0%), then something is wrong.
Trial & error to isolate the cause of insufficient sleep states
We can now do a little trial & error to see what effect this has on the sleep states.
Reminder: this analysis is only helpful if the NVIDIA GPU was already excluded as a root cause.
Beginner-friendly steps:
- Put the laptop into power saving mode
- Put the laptop into airplane mode
- Remove as much periphery as possible, incl. USB and network cables
- Observe situation both with and without power supply
- Change refresh rate, Adaptive Sync and other graphics options (details below)
- Remove as much software from the autostart as possible
- Uninstall suspicious software
- BIOS reset (Load Defaults, Save & Reset)
- Uninstall the Control Center software associated with the laptop
- EC and BIOS update (see instructions) and BIOS reset again
Uninstalling suspicious software has often led to improvements in the past. Here are a few examples:
- Corsair iCue (source)
- Epic Games Launcher (source)
- Paint 3D (source)
- Intel Driver & Support Assistant (source)
- Outdated Killer WLAN drivers (or Killer Performance Suite)
Of course, these examples might only reflect a moment in time. It may well be that newer versions of these programs have fixed their problems or reduced their CPU consumption. But there might also always be new problems of this kind with different applications. The developers are not always to blame: it can very well happen that a new Windows update causes any program to run out of sync, e.g. by abandoning a previously used API method, and corresponding requests from third-party software then run into a timeout.
If such sleep-breaking issues are found on any particular software, it’s always best to notify the software vendor directly.
When refresh rate, Adaptive Sync and Modern Standby have a negative impact on sleep states.
Windows is now packed with new features that are supposed to reduce energy consumption. These include Modern Standby (S0ix) and various techniques that regulate the consumption of the LCD panel, for example by dynamically lowering the refresh rate if no active content is displayed on the screen. Most of these options were established with the 11th generation Intel Core (Tiger Lake).
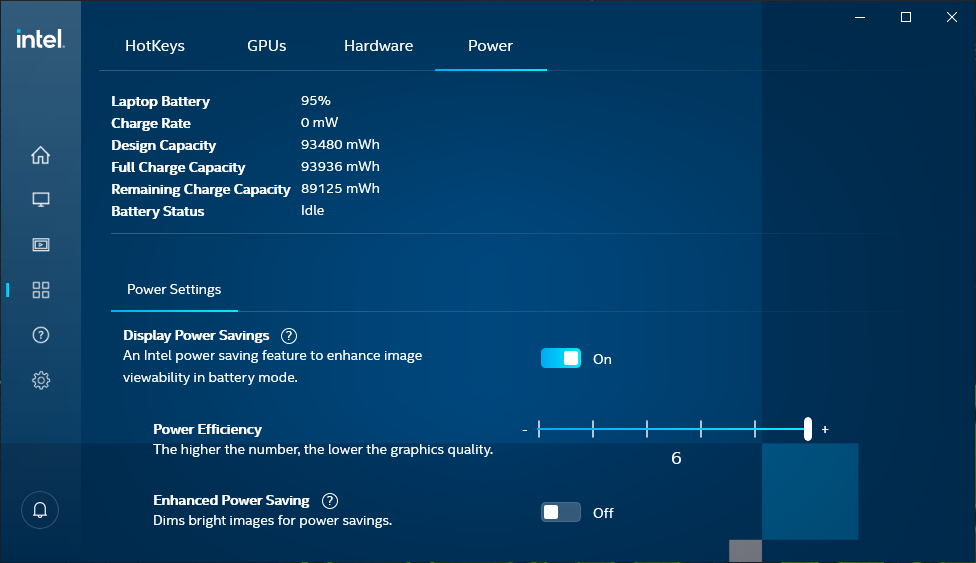
If the laptop’s display is connected to the Intel graphics (if NVIDIA Optimus is active or if the laptop doesn’t have NVIDIA graphics at all), then you can control many of these options in the Intel Graphics Command Center. You can find this in the start menu by searching for “Intel”.

Possible options are:
- Changing the refresh rate – e.g. a reduction to 60Hz
- Adaptive Brightness
- Panel Self Refresh
- Display Power Savings
- Enhanced Power Saving
We have recently found that some of these options can have a adverse effect on power consumption and sleep states on certain systems. An investigation into this has just begun (November 2021). If other options have already been exhausted, we are happy to advise playing around with these Intel graphics options as well.
Trial & error for advanced users
Once the above factors have been largely ruled out, we can go one level deeper.
- Undo the activation of optional Windows features. Examples:
- Virtual Machine Platform
- Windows Hypervisor Platform
- Windows Subsystem for Linux
- Check whether all device drivers are correctly installed. For example, it can happen that a device may be working, but it still keeps the CPU from sleeping due to missing drivers (example).
- Remove the system memory (RAM) and test it with only one module if necessary (see notes in the FAQ section on Maintenance).
- If there are several SSDs in the system: remove the SSD on which Windows is not
- Disconnect the Wi-Fi module from the mainboard.
- Perform a clean Windows reinstallation.
- Install Windows on an SSD of a different type.
The notes about the SSD are not arbitrary here: there has already been at least one case where an M.2/PCIe SSD from a smaller SSD manufacturer resulted in the CPU not being able to go into deep C-states. At that time, it was an SSD that was not offered for sale by XMG.
If none of these steps lead to a significant improvement in CPU sleep states, please contact us or open a new conversation in our community.
If you noticed an improvement between the different trial & error steps, but are still not satisfied with the result, please document the before/after state. For example: note which is the “deepest” sleep state reached in idle and how much time (in percent) the CPU spends in this state. Additionally, please note with which of the steps outlined above the situation has improved significantly.
CPU consumption low, sleep states okay – but still high battery consumption? Almost impossible!
For comparison: a correctly installed XMG gaming laptop should show a consumption of less than 10 watts in idle battery mode under normal conditions. The CPU package power should be below 3 watts on average.
If your battery consumption is above 10 watts or even far above 20 watts, although your GPU is asleep and your CPU package power is below 3 watts, then something is really wrong. Such cases are extremely rare and poorly documented – so this section is rather academic. If you still have such a situation, please contact us.
Other potential power drains in the system are:
- Display
- Keyboard
- System memory (RAM)
- Wi-Fi module
- Other mainboard components (LAN adapter, card reader, Thunderbolt etc.)
The display is of course the most obvious consumer: if you compare the battery consumption (charge rate with minus values) between maximum and lowest screen brightness, you should notice a difference of a few watts. The higher the physical screen resolution and the higher the brightness, the higher the consumption. OLED displays consume more when showing white/bright content than when showing a mostly black screen.
For comparison:
- 17.3″ Ultra HD (4K/60Hz) in XMG ULTRA 17 consumes a maximum of 8.4 watts.
- 15.6″ WQHD (1440p/165Hz) in XMG NEO 17 consumes a maximum of 5.9 watts.
- 14.0″ Full HD (1080p/120Hz) in XMG CORE 14 consumes a maximum of 4.7 watts.
These values are based on the spec sheets of the respective panel manufacturers and include both the panel’s logic and its backlight at maximum brightness. This comparison shows quite well the range between different screen sizes and resolutions. The comparison also shows that we currently do not offer panels that consume more than 10 watts. Thus, a battery consumption of more than 20 watts cannot be caused by the LCD panel alone.
The keyboard illumination is also relatively insignificant: the savings by turning off the keyboard illumination are hardly measurable. The system memory and Wi-Fi module can also consume power, but their consumption is usually also capped at relatively low values. The system memory’s consumption is also linked to the CPU’s consumption: if the CPU is asleep, then the system memory cannot be busy either.
Note on laptops with a desktop CPU
The comparison values given in the previous sections only apply to laptops with mobile CPUs. Laptops with desktop CPUs (XMG ULTRA and some variations of XMG APEX) have much higher consumption rates on average and do not use NVIDIA Optimus – so the dGPU is always active in them. However, desktop CPUs should also be able to reduce their power consumption when idle. So you can use the above mentioned analysis methods for desktop CPUs. The minimum consumption will be higher, though; a desktop CPU won’t reach such low sleep states due to the permanent dGPU connection. For a comparison with the community, we recommend the channels #xmg-apex-xl and #xmg-ultra on our Discord server.
Contact us with screenshots and logfiles
If you want to contact us or open a new conversation in the community, it helps us to know as much about your system as possible:
- How is your system configured?
- Which of the above steps did you follow?
- What results did you get? Do you have screenshots and log files?
For a deeper analysis you can create a full sensor log with HWiNFO64:
- Click on the green [+] symbol in the lower right corner of the sensor view.
- Define the folder and filename of your new log file.
- As soon as you click on “Save”, HWiNFO64 will start logging.
- The green [+] symbol has now changed to a red “x” – you can stop logging by clicking on that button again.
During logging all sensor values are written to a CSV file every 2 seconds. This CSV file can later be analysed with the free tool GenericLogViewer or further dissected with a spreadsheet program.

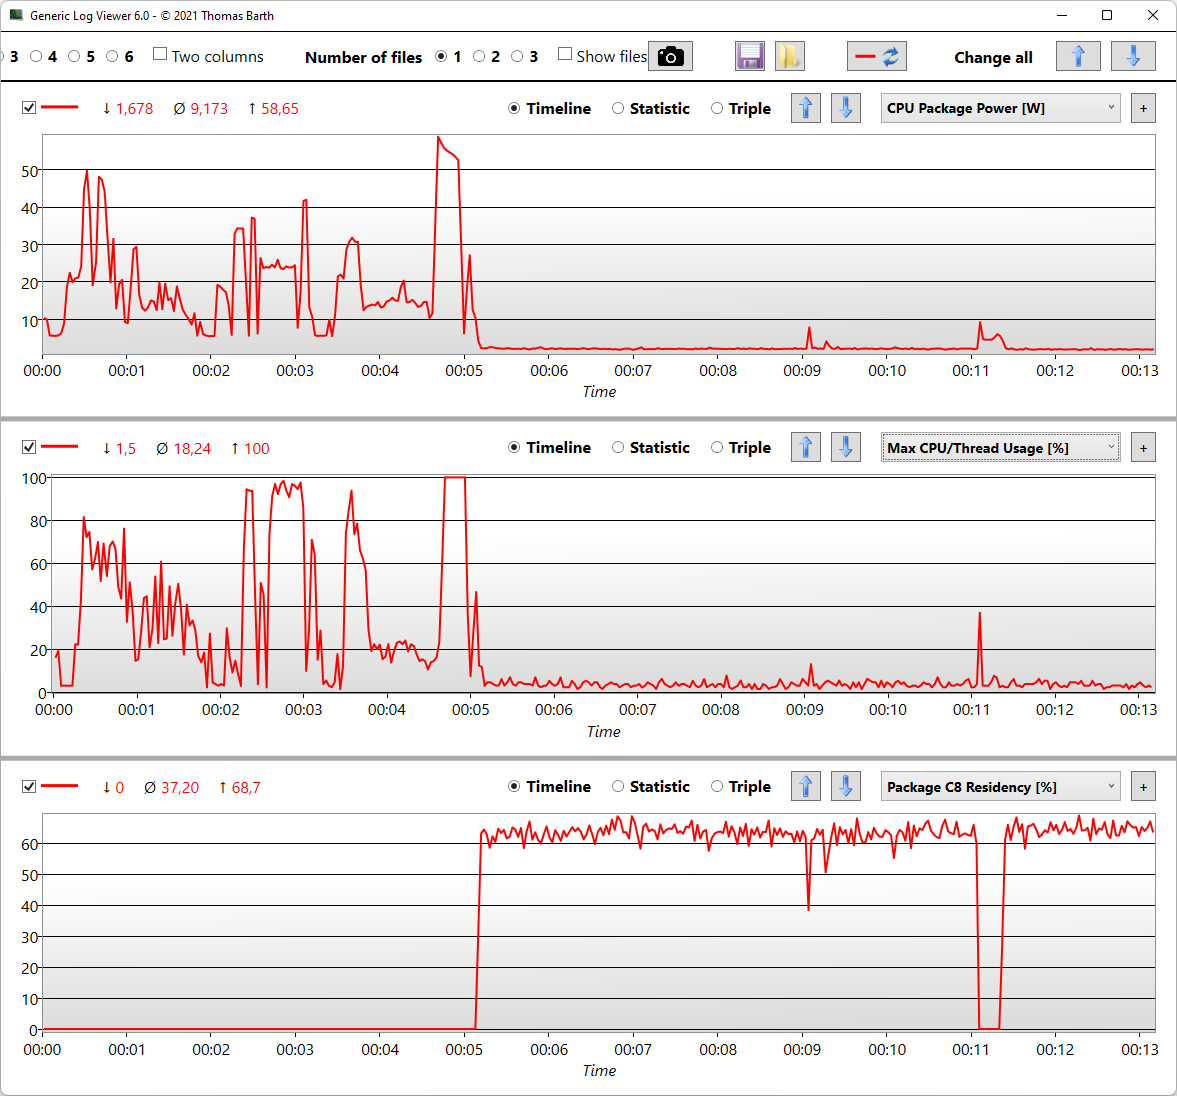
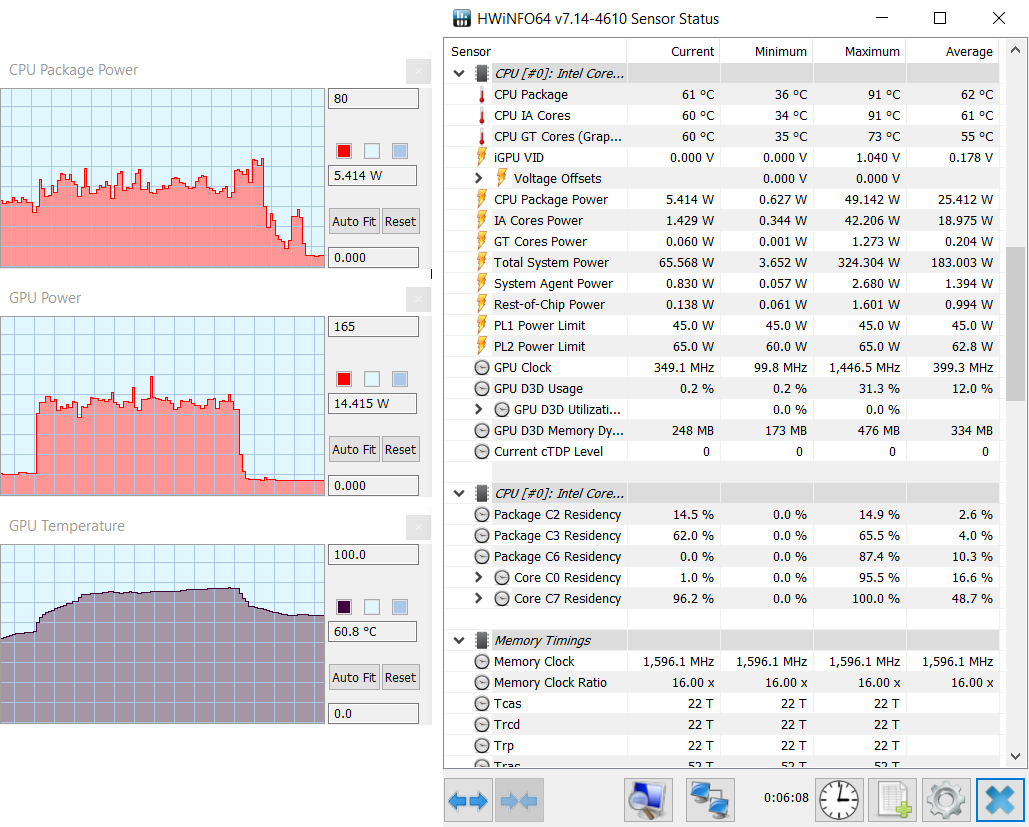
In this example screenshot you can see how the CPU power consumption drops to well below 5 watts after the end of a benchmark while the package C8 residency increases to over 60% at the same time. You can display as many diagrams next to each other as you want. The X-axis is synchronized so that the diagram lines are always in direct relation to each other.
Two well written guides on this topic can be found here:
Both links lead to the wiki of r/TechSupport, a subreddit for general PC/Tech support.
Creating a System Report with HWiNFO64
A system report lists all installed hardware components and all driver and firmware versions. This can be helpful later on when troubleshooting.
- Restart HWiNFO64, uncheck “Sensors-only” and click “Run”.
- In the big window you will find a big disk icon in the upper left corner, labeled “Save Report”.
- Now click on “Browse” and define folder and filename for your report file.
- Click on Next and leave all other options as they are.
- Afterwards a HTML file will be created, which we can comfortably read in our browser.
The system report does not contain any personal data – even the name of the user account is not included.
However, it does contain serial numbers of components from which we can derive the customer number and production date through our inventory management system. Such details can help our support team in troubleshooting as well.
Final words
Windows PCs are complex, Windows laptops are more complex – due to the high degree of freedom in terms of components and installed software, the high level of integration of firmware and hardware, and the high demand for energy-saving potential and battery life, there is virtually an infinite number of potential things that can happen. We hope to have helped you with this detailed guide in an active and solid troubleshooting.
Well-researched customer feedback can of course also help us identify and eliminate bugs and errors in our own hardware and firmware. We are also happy to pass on solid feedback to our suppliers and partners. If you have come to the conclusion that we or one of our partners have a serial defect, please do not hesitate to contact us.
 Next level cooling
 Next level cooling
 Next level cooling
 Next level cooling
 Uncompromised Cooling
 XMG SECTORDetails
 Uncompromised Cooling
 XMG SECTOR WHITEXMG SECTOR XXMG SECTOR X WHITEXMG TRINITY
 As Individual As You
 XMG TRINITY XDetails
 As Individual As You
 XMG TRINITY X
 As Individual As You
 Audio PCsXMG STUDIO
 XMG UNIFY C1Details
 XMG UNIFY C2Details














































 In the screenshot: Furmark is manually set to the iGPU.